The Oxford BSP toolset profiling tools
The distribution of the Oxford BSP toolset contains three different
profiling tools: (1) a call-graph tool that
analyses the imbalance in either computation or communication that is
present in an algorithm; (2) a performance profiler
and prediction tool that analyses the communication patterns that
arise during program execution, and enables the user to predict the
performance of an application on any other parallel machine; and (3) a
prof style profiling tool called bspsig.
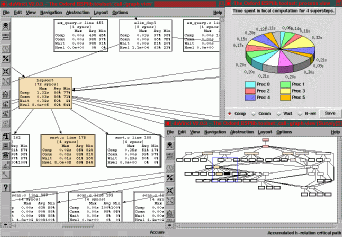
 The screenshot to the
left shows the use of a post-mortem call-graph profiling tool
that analyses trace information generated during the execution of
BSPlib programs. The purpose of the tool is to expose imbalance in
either computation or communication, and to highlight portions of code
that are amenable to improvement. One of the major benefits of this
tool is that the amount of information displayed when visualising a
profile for a parallel program is no more complex than that of a
sequential program.
The following papers provide an overview of the profiling tool, and
a description of its use in analysing an SQL database query processing
application:
``Analysing an SQL application with a BSPlib call-graph
profiling tool'' Jonathan
M.D. Hill, Stephen
Jarvis, Constantinos
Siniolakis, and Vasil
P. Vasilev. In EuroPar'98, LNCS,
Springer-Verlag, September 1998.
``Portable and architecture independent parallel performance
tuning using a call-graph profiling tool'' Jonathan M.D. Hill, Stephen Jarvis, Constantinos
Siniolakis, and Vasil
P. Vasilev. In 6th EuroMicro Workshop on Parallel and Distributed
Processing (PDP'98). IEEE Computer Society Press, January 1998.
[See also Technical Report 17-97, Programming Research Group,
Oxford University Computing Laboratory, May 1997. (html
document; Compressed
Postscript, 284K)]
An introduction to the tool and its user interface can be found
here.
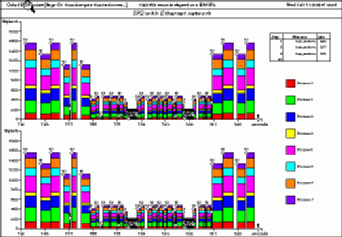
 The screen-shot to the left shows a profile of a
multi-grid computational fluid dynamics application running on an IBM
SP2 configured with Ethernet. As a comparison, the profile here was
produced with the SP2 configured with high-performance switch. The
profiling tool graphically exposes three important pieces of
information: (1) the elapsed time taken to perform communication; (2)
the pattern of communication; (3) the computational elapsed time. The
top and bottom graphs show the number of Kbytes leaving and entering
each process on the y axis, and the elapsed time on the
x axis. Each pair of vertically aligned bars in the two graphs
represents the number of Kbytes of data leaving and entering a process
during a superstep. Within each communication bar is a series of
bands where the height of a band represents the amount of data
communicated by the process identified by the band's shade. The sum of
all the bands is the height of the bar which represents the total
communication across all processors for a superstep. The width of the
bar represents the elapsed time spent in both communication
and bulk synchronisation. The theoretical cost of this is
hg+l. The label found at the top left-hand corner of each bar
can be used in conjunction with the legend in the right of the graph
to identify the end of each superstep (i.e., the call to
bsp_sync) in the users code.
The following paper describing the use of the profiling tool to
analyse a multi-grid CFD application:
An introduction to the tool and its user interface can be found here.
Jonathan
Hill
Last updated: June 11th 1997
 The screenshot to the
left shows the use of a post-mortem call-graph profiling tool
that analyses trace information generated during the execution of
BSPlib programs. The purpose of the tool is to expose imbalance in
either computation or communication, and to highlight portions of code
that are amenable to improvement. One of the major benefits of this
tool is that the amount of information displayed when visualising a
profile for a parallel program is no more complex than that of a
sequential program.